The Last Day

Hello all,

Today is the last day of our residency program! Over the last nine months, we’ve attended and presented at numerous conferences, organized and supported community events, written blog posts here, for The Signal, and our personal blogs, participated in webinars and workshops, and…oh yeah, completed entire projects at our host institutions. We held a Capstone event this week that allowed us to share the final outcomes of our projects with the public and to reflect on what we’ve learned. As we move on to the next phase, I know the lessons learned, challenges faced, and successes we’ve had will stay with us, and most importantly, so will the network and community we’ve built as members of the NDSR program. Thank you to Nancy McGovern, Andrea Goethals, and Kristen Confalone for coordinating this program and guiding us through the process. And thank you to Nancy, Andrea, Erica Boudreau, Joanne Riley, Andrew Elder, and Alix Quan for your support as our hosts and mentors. We appreciate all of the assistance and encouragement we’ve gotten from the greater community as well.


Signing off,

NDSR Boston

Documentation & Policies

As we near the end of the residency, I’ve mostly focused my efforts on writing documentation and policies for the State Library of Massachusetts. Prior to my project, there was limited or outdated documentation and no policies in place regarding the management of the library’s digital content. This is the position that many institutions are in when beginning to consider digital preservation; it takes a lot of effort and commitment just to begin, but it is important to do so. Writing both documentation and policies will hopefully go a long way in establishing a digital preservation program at the State Library.

Documentation

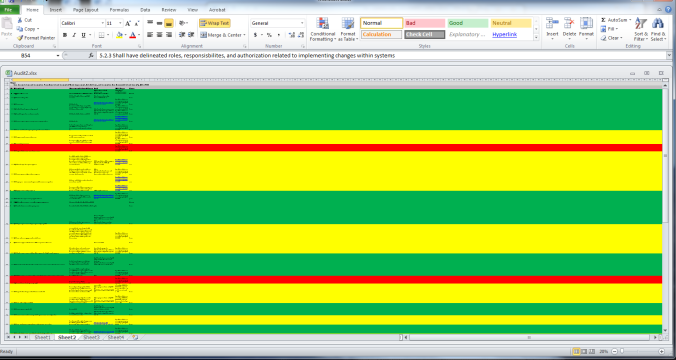
In addition to much of the documentation being outdated, there also seemed to be a disconnect between what the documentation said and what the library staff was doing in practice (a common issue!). The documentation needed to be updated to reflect current practices, to act as a record of the decisions we’ve made through this process, and to ensure transparency in the State Library’s activities.

Knowing that documentation was a key deliverable of the project, I tried my best to document my activities as I went. For example, after meetings with institutions such as the Massachusetts State Archives and MassIT (the Massachusetts State IT Department), I typed up and organized my notes, then made them accessible to staff members through our shared server. These conversations informed some of our practice and I wanted the State Library staff to be able to refer to these notes later if needed. I also documented the process of testing and selecting a tool for batch downloading PDFs. We ultimately decided to use DownThemAll, a Firefox add-on, but I researched a few other options first. I included my notes on these options in documentation as a record of the decision-making process. In the last month, I made sure to review these notes and update them, as well as create documentation for any missing pieces.

We now have documentation on processes such as web statistics, batch downloading, renaming files with the command line, using Archive-It, creating and disseminating a survey to state libraries and archives, and our outreach methods. I hope this will help staff members better understand the decisions we made, the approaches we took, and how they can build on the work we’ve done through NDSR.

Policy Creation

In addition to documentation, policies are an important facet of a digital preservation program. Among other things, policies explicitly state an organization’s commitment to a program or project and defines an organization’s role and operating principles.

I wrote policy statements for the State Library’s collection development activities and their digital preservation program. First and foremost, these policies are meant to be working documents that are continually reviewed and revised over time. These are starting points to build on as the organization changes over time.

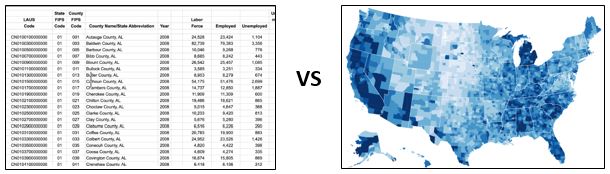
The collection policy statement is the culmination of what we learned through our analysis of the web statistics. After conducting the assessment, we had a list of the high and low priority documents we aim to collect and a description of the value-based judgments that led us to categorize documents this way. I feel that this adds a level of transparency not previously in place. This statement will be used as a guide when identifying and selecting valuable content moving forward.

The digital preservation policy statement describes the legal mandate that the State Library faces, the scope of the program, challenges faced, the roles and responsibilities of the State Library in tackling digital preservation, and more. Defining details such as the file formats we accept, our focus on collaboration, our intended audience, and our guiding principles allows the State Library to move forward in its efforts to preserve digital content with this as a reference guide.

Updating these policies or creating new policies as the State Library’s delves deeper into digital preservation is key.

Early in the NDSR program, we, as a group, assessed our host institutions against a few benchmarks to get an understanding of where our organizations stood and to better understand the steps we should consider in moving them forward. Using the Five Organizational Stages of Digital Preservation benchmark, I concluded that the State Library was at Stage 2, meaning that they were advancing from understanding the need for digital preservation to taking on a digital preservation project (NDSR!). Though no formal policies were in place, the State Library understood they needed to better manage the digital content in their collections and demonstrated a commitment to doing so through participation in the NDSR program. My hope is that a successful NDSR project, an assessment of the scope of existing content, an increased knowledge of how similar institutions handle these tasks, and the development of documentation and policies will all assist the State Library advance towards Stage 3, in which they build a long-term digital preservation program.

My fellow residents and I will be presenting our project posters at Harvard on Monday, May 23 from 3-4:30. Check here for more information and hope to see you there!


Sources

Anne R. Kenney and Nancy Y. McGovern, “The Five Organizational Stages of Digital Preservation”, http://quod.lib.umich.edu/cgi/t/text/text-idx?c=spobooks;idno=bbv9812.0001.001;rgn=div1;view=text;cc=spobooks;node=bbv9812.0001.001%3A11.


ALA Preservation Week

Hello, friends,

As some of you might know, last week was ALA’s Preservation Week, which is an event that raises awareness about preservation activities in libraries. Across the countries, libraries hosted events and activities that taught the public about preservation, covering everything from collections care in libraries to how individuals can preserve their own books and photographs.


A few months ago, I decided I wanted to do some outreach as part of my “20% time,” and so, through talking with some of the preservation staff here at Harvard, I learned about preservation week. There was a committee that was planning events for the week here at Harvard. They also partnered with MIT to plan a big kick-off day on Monday. I got involved with the committee and was also able to plan my own digital preservation-related event as part of the festivities. The committee decided to have different “pop-up” tables at different libraries throughout the week – tables where visitors could stop by for a few minutes and learn something about preservation.

After thinking about what would be most interesting to students, staff and faculty here at Harvard, I decided to plan a “pop-up” on personal digital archiving. I thought this would be most interesting to this audience because it’s something a lot of people struggle with – how do they save all their stuff? How to they prevent loss? Or, sometimes, it’s something people don’t realize they should be thinking about – they don’t realize that all of their digital photos could disappear if they’re not careful! Yikes!

I called my event “How to Save Your Digital Life,” which I thought might catch people’s attention more than calling it, for example, “personal digital archiving.” It’s always good to add a little drama! Additionally, to catch people’s eyes, I borrowed some legacy media formats from staff here at Harvard, pictured below.  I thought people might get a kick out of seeing all these old formats (floppy disks! Tapes! Practically ancient relics!), and I thought it could also be a good teaching tool. It was a way to visually demonstrate to visitors how quickly technology can change, and how once-popular storage formats can become obsolete.

IMG_9515

Vintage

I set-up my “pop-up” table twice during preservation week – once during our big opening day, in Lamont Library, and once in the Loeb Design Library at the Graduate School of Design. The event in Lamont was very well-attended, and I got some visitors at Loeb, too, although it was a little quieter – the students were getting their work reviewed that day. For my table, I gave a little 2ish minute spiel about personal digital archiving – I talked about inventorying and prioritizing what you have, adding meaningful file names (like “Photos Spring 2016” instead of “stuff” or random numbers) and metadata to files, saving multiple copies, and staying aware of changes in technology. I also showed visitors how they could request their archive from social media sites, which I thought might be of interest to students. I also passed out little half-page tip sheets, the text of which I’ll include below. I got a lot of ideas for what to talk about from this handout I found online from MIT – thanks, MIT!

Overall, visitors seemed pretty interested in personal digital archiving (it also helped that I had snacks.) I got a lot of interesting questions – people seemed to be especially concerned about cloud storage and whether it’s a good idea. (My advice – it’s okay for a second or third storage option but you don’t want to rely on it entirely) . People were also curious about what file format to save their photos in, and how high resolution their photos should be (my advice- it depends on what you want to use them for. The answer is always it depends!).

Below is the text of my tip sheet. It’s a bit simplified – partially because I wanted to make it fit on half a page, and partially because I didn’t want to overwhelm people. But I thought it would be good to get people started – hopefully it got the students thinking about how they can keep their digital stuff safe!

Thanks for reading!

SaveYourDigitalLife-JulieSeifert-byPAnderson

At my pop-up table. Photo by Priscilla Anderson.


Tip Sheet:

Save Your Digital Life

  1. Find It
    1. Where is your media? On your iPhone? Your computer? Google Drive? A CD?
  2. Prioritize
    1. What do you want to save? What’s important? Anything at risk for disappearing?
  3. Organize
    1. Use file names that are meaningful to you, organize files into folders. Add information like “song name” to songs or “dates” on photos.
  4. Save It
    1. It’s best to save at least two copies of your media. For example, one on your computer, one on an external hard drive.
    2. Even better, consider saving two or three copies in multiple physical locations. For example, one on your computer, on an external hard drive in your house, and one on an external hard drive elsewhere.
  5. Keep an eye on it
    1. Remember that technology changes. Stay ahead of these changes! Ex: If you had something saved on a floppy disk in 1999, you should’ve gotten your files off that disk before they stopped making computers with floppy disk drives.

Social Media – Many popular social media sites such as Facebook and Twitter offer archiving services where you can download things you’ve shared on the site. Search online for more information about these services.  If you think you might want something you posted online later, make sure it saved somewhere OTHER than that site.


NDSR Project Update from UMass Boston

Hello Readers.

The weather in Boston is beginning to warm. The Red Sox have opened their season and the Boston Marathon was run earlier this week. No doubt the crew teams are rowing in the Charles and the Swan Boats will soon be paddling across the pond in the Public Garden. Although spring is the season of renewal, this year it signals the end of the 2015-16 NDSR Boston projects.

swan boats Boston-Common-1889

Swan Boats in Boston’s Public Garden – image by George Barker 1889

For this blog post, I thought I would update you on the progress I have made on my project so far. To refresh your memory, my project is developing and implementing a digital preservation plan for the University Archives and Special Collections at UMass Boston using Archivematica and DuraCloud. The collection I am working with is the Mass. Memories Road Show (MMRS). I began the project researching digital preservation standards and best practices while familiarizing myself with the digitization and digital asset management practices in use at UMass Boston. I have been busy lately adjusting existing practices for processing digital collections and developing preservation workflows related to the use of Archivematica.

Performing a gap analysis early in the project was an important step. By comparing the existing practices at UMass Boston with digital preservation standards, guidelines and best practices, I identified the greatest areas of need as preparing the collection for ingest and implementing archival storage. To address these broad areas of need, it would be necessary to incorporate the following tasks into the digital preservation workflow.

  1. Generate checksums
  2. Screen for duplicate and unwanted files
  3. Create/assign unique IDs to files
  4. Store files in multiple locations
  5. Include descriptive metadata in archival storage
  6. Create/manage administrative, technical and preservation metadata

Archivematica addresses several of these issues. Other needs are being met by making adjustments to the existing practices.

red sox scorecard 1934

Boston Red Sox Scorecard 1934 – image from FenwayParkDiaries.com

I discovered that the first two tasks identified by the gap analysis were related. Generating checksums is an important task because it protects the authenticity and data integrity of the collection. Checksums, created by applying a cryptographic algorithm to the file, produces a unique alphanumeric code for each file that acts like a digital finger print.  Periodically verifying that checksums have not changed provides evidence that the file has not been modified or damaged over time. Since the objects in the Mass. Memories Road Show collection are copied between hard drives several times and uploaded to the cloud, it is necessary to have a way to verify that each file has retained its original bit stream.

Checksums also played an important role in helping to identify and remove duplicate files. The existing file processing workflow had resulted in the accumulation of numerous duplicate video files. Duplicate files have identical checksums. A checksum tool called The HashMyFiles generates and compares checksums, and identifies when two or more files are identical. Using this tool, 3,500 video files occupying about 200GB of space were removed from the collection, saving critical processing time and storage capacity.

crew practice on the charles river

Crew practice on the Charles River – image by Leslie Jones ca. 1930

Other modifications being made to the file processing workflow involve adopting a file copying tool and standard terminology, adjusting the file naming conventions and digitizing registration forms. Usually a file’s creation date is overwritten when the file is copied. A tool called TeraCopy has been adopted to copy files because it retains the original creation date. Standard terminology has been adopted as well. Digital files that were previously categorized as “originals” and “edited masters” are now identified as “preservation masters” and “production masters.” Since preservation master files and production master files often share identical file names, suffixes have been added to the file naming convention to differentiate the two types. Preservation masters are now identified by an “.f0” suffix while production masters are labeled with an “.f1” suffix. Lastly, registration forms, which give UMass Boston consent to use the digital files in the collection, will now be digitized and uploaded to archival storage with the files they represent, providing additional intellectual control.

Archivematica specific adjustments are also being made to the workflow that will protect the collection’s data integrity, manage metadata and assign unique identifiers to the collection and to the files. An additional checksum file and a text file with descriptive metadata will be created and uploaded to Archivematica with each submission. Archivematica uses the checksum file to verify files are not damaged during the upload to the Archivematica servers. Archivematica parses the descriptive metadata file into a METS file allowing the descriptive metadata to be stored with the collection in DuraCloud. The normal Archivematica processing extracts technical metadata from the files, generates additional administrative and preservation metadata, and creates and assigns universally unique identifiers (UUIDs) to the objects in the submission. The metadata is all saved into the previously mentioned METS file, satisfying all digital preservation best practices for metadata. The UUIDs are saved to a text file which will be downloaded and imported into the digital asset management system ensuring that the identifiers created during archival storage are associated with the access copies.

So, a lot of progress has been made thus far. There are still a few decisions to make and a little more testing left to do before the entire collection can be uploaded to the cloud, processed through Archivematica and deposited in DuraCloud. The final tasks will be to finish documenting the new procedures and training the archives staff to use the new digital preservation tools and Archivematica.

Johnny Miles Crossing Tape in Race

Boston Marathon winner Johnny Miles 1923 – image by Underwood & Underwood/Corbis

The Boston Marathon is an appropriate metaphor for the NDSR project. There is a lot of anticipation and a “feeling out” process in the beginning. This is followed by a period where you settle in to a steady and comfortable pace. Along the way, you encounter and overcome challenges. At this point, you have made it over Heartbreak Hill. Next, Boylston Street and the Finish Line come into view and there is a hectic push to the end. After crossing the Finish Line, there will be the satisfaction and sense of accomplishment that comes with the successful completion of the end of the project. Maybe the traditional meal of a big bowl of pasta will be my reward.

Thanks for reading, Jeff

Web Statistics: CHECK

We’ve accomplished a big milestone here at the State Library—we have completed our review of the web statistics! One of the main objectives of my project was to perform a comprehensive assessment of Massachusetts state government publications and we chose to use web statistics as a way of accomplishing this goal. The web statistics, gathered by Mass.gov., showed us where on agency websites materials are posted and also, after a categorization process, tells us what kinds of content agencies are producing. Implementing a priority ranking system, we also see what kinds of documents are high priority or low priority (according to the collection policy statement we created at the beginning of this process).

We began working with the web stats as a means for identifying and selecting the content we want to preserve and provide access to through the DSpace repository. As the residents learned in our first few months of NDSR, the identification and selection of content are the first steps an institution should take in planning for current and future preservation needs. Reviewing the documents from the web statistics answered the questions of what content our producers create, what content are we required to keep, and what content do we feel is most valuable to the library. The answers to these questions will inform an inventory of the kinds of content that agencies produce and will help us update the collection policy statement that we began working on in the fall. The policy statement is meant to be a living document that is continually updated as priorities or types of content change.

Having a policy statement then guides the selection of content for long-term preservation and access. Referring to documentation of our practices allows the staff to make well-informed decisions about what kinds of content is most valuable for the library and its patrons, and helps us maximize resources. Rather than spending time and energy capturing things like ephemeral material, we can allocate time and resources towards capturing things like reports or meeting materials. Our policy is something we can use to select materials as well as justification for these decisions if a patron asks why we capture certain items and not others. Documenting these actions and procedures is an important step for the State Library in building their digital preservation practice.

So how many documents did we go through? All told, we reviewed and appraised over 75,000 documents, which is pretty incredible! Many of these documents are already in DSpace and many are low priority, so we do not need to catalog and ingest every single one. I’m currently compiling and analyzing the data we pulled from the statistics (which includes the total number per agency as well as the breakdown of monographic and serial documents). I’ll know more soon about how many high priority documents we need to handle, and then will be working on a plan for the low priority documents as well. All of this will be documented and included in my final report for the State Library. In addition to using the data collected from web statistics in the identification and selection process, the web statistics allow us to use quantitative data as justification for requesting additional resources. Knowing that we have only so many resources in place currently and seeing how much work needs to be done (with data to back that up), we can use this as proof of what resources we should add to handle the workload ahead.

This process was not always shiny or fancy, and at times it was an uphill climb (going through 10,000 documents from one agency was a particular low point for me!), but we continually fine-tuned the workflow until the whole staff got into a steady rhythm. This was a great lesson for me in designing and testing workflows over time, being flexible and open to new ideas, and keeping the big picture in mind. Some of the challenges included managing many, many spreadsheets at once, tracking progress over time (as each staff member was responsible for their own agencies, but I was in charge of the big picture so I needed to be kept up-to-date on everyone’s status without being overbearing), and ensuring we were capturing only the necessary data (which was part of the workflow evolution. We began tracking lots of data, then boiled it down to the most essential to save time). Every tweak or change in the workflow was done in service of getting a better understanding of the scope of state publications, and ultimately I feel we’ve achieved that.

I’m taking the team out for a lunch next week to thank them for all of their help reviewing these and to celebrate this accomplishment. Again, this step meets a major goal for us and will help inform the next steps for my project. With a month left, I’ll be documenting this whole process and including much of my data collection in a final report for the State Library. Thanks for checking in!

-Stefanie

MIT Libraries Host Event: Resumes & Interviews

On Wednesday March 30th, MIT Libraries held their NDSR Host Event, a Resume and  Interview Workshop. Each NDSR resident brought the description of a job for which they wanted to apply, their resume, and a cover letter. The residents paired up with an interviewer (NDSR hosts) to review their resume and cover letter to see if it addressed a job description. The interviewers posed some questions to each Resident as practice then provided some suggestions for real job searches. I enjoyed organizing the event and learned a lot from the discussions. I hope the feedback will be as helpful to you as it has been to me.

Before the interview, it is important that you do your research about the job and the institution:

  • Be prepared for questions about what interests you about the job.
  • Learn the institution’s terminology.
  • Look over the projects they are doing and think about how you could contribute to them
  • Arrive early to the interview but wait till actual interview time to approach them. This is a weird balancing act.

Here is some advice from the hosts about preparing for the interview:

  • In your interview, try to define the more technical lingo if it’s not already defined in the job description. This is a delicate balance between showing that you know the lingo and lecturing the interviewers. You want to be able to do the former, not the latter.
  • Show how your skills can transfer to the job, point out similarities between this job and your past jobs, and have different examples ready to showcase collaboration skills.
  • When they ask the question “How can you bring your knowledge into the institution?” you can wrap your answer around the institution’s future projects and/or mission.
  • When asked a question referencing the “required experience” skill set, make a case with examples that are short and to the point.

At the end of the interview, there is a question that is almost always asked: “Do you have any questions for me/us?”

  • One thing that rarely considered is that the job interview works both ways.  During a job interview you also have the opportunity to decide if you would really like the position, your co-workers, or the institution.
  • If the job description has everything but the kitchen sink in the list of duties/skills, you can ask: “This is a really wide range of skills you are looking for.  What are your priorities?”

Presentations can be a part of an interview process, since it is all about communication. Here are some tips for presentations:

  • Address the question.
  • Be aware of time.
  • While creating your presentation, ask yourself if you are addressing the topic within the time frame while saying it well.
  • Practice.

Having references is key. Before this event, I hadn’t given much thought on their importance to a job application. I assumed I would get good reviews if someone indicated that I could use them as a reference.The following feedback proves how wrong that assumption was:

  • Before you apply for a job, send your chosen references the job description and ask them if they will be a reference for a particular job before you apply.  Nothing is worse than having them ask your interviewers “So what job is this in reference to…?” or “What’s their name, again?”
  • If you will need recommendation letters, let your references know at least two weeks ahead of time—longer if possible.
  • Ask your reference if they would give you a positive reference. If they won’t, don’t use them as a reference. Imagine your interviewers getting this response: “She really gave me as a reference?”
  • In the document listing your references, write why that person is a reference for you.
  • Take into account how responsive your reference is, and whether they are likely to return emails or phone calls.
  • A very hard, but good question to ask your reference “Would you hire me again?” You may not want the answer, but it’s a less subtle indicator of what your reference will say about you!

Good luck!


Update on My Project

Hello friends!
Spring is here, allegedly, although you wouldn’t know from the snow we got recently. But it’s beginning to warm up, the river is thawing, and Harvard Yard is filling up with robins and tourists…

IMG_9466

Spring comes to Cambridge (taken on March 22nd)

The arrival of “Spring” also heralds the end of our residency…that May 31st deadline is on the horizon now.  In the next few months, I’ll be trying to tie up all the loose ends and finish up the project, and I thought I’d update you on what I’ve been up to so far.

The big news is, I officially finished the “self-assessment” phase of my project (also the longest phase). Hooray! If you recall from my earlier posts, I was using an Excel sheet to track how Harvard met the different metrics of the ISO16363 – green for things that are being done and documented, yellow for things that are being done but not documented, and red for things that are not being done at all. So now the spreadsheet is all filled in!


auditmarch.png

Zoomed out so you can see all the colors


Now that that’s all done (whew!), I’m working on summarizing my findings in a report. Then, with the report done, I’m going to attempt to make some data visualizations that show my results in a more visually appealing manner. Andrea has given me some questions, which I’ll share below, and which I hope to address with the visualizations and my report. They are:

  • Where do we stand related to the standard?
  • Where are the gap areas?
  • How can we characterize the gap areas?
  • How might we address the gaps? What would be a good strategy to approach tackling the gap areas?

In particular,  I am looking to see what the commonalities are, if any, among the gap areas. My hope is that I can suggest a few documents that could be made and could fill several gaps at once – this would allow the DRS to fill the gaps most efficiently. For example, one thing I’ve found so far is that many of the yellow areas are related to the ingest process, so it seems like a document about the ingest process could fill several gaps at once. In the coming weeks, I’m going to continue to look for those kinds of commonalities and try to display them visually. I got some good ideas from Helen at our workshop last week (which Jeff blogged about), and I hope I can find a good way to display all this information.

Also, outside of the main project, I’ve also been working on a few “twenty-percent” things, those professional development, non-project projects.

For example, the rest of the residents and I will be hosting a webinar in a few weeks for Simmons Continuing Education. We’ll be talking about different standards, such as ISO16363, and how these standards can be used for a gap analysis.

Additionally, during the last week of May, I’ll be participating in ALA Preservation Week here at Harvard. I’m going to have a table about Personal Digital Archiving, and I’ll be rotating around to different libraries and schools on campus and teaching students about how they can save their digital lives!

Finally, I’m recording a webinar, along with D.C. resident Jessica Tieman, which we’ll make available to other NDSR residents afterwards.

So…lot’s of stuff going on! It’s going to be a busy couple of months, so make sure to keep checking back here at our blog to see how things wrap up!


Data Visualization: Choropleths and Cartograms and Treemaps, oh my!

Hello Readers.

Last week the NDSR Boston cohort visited with Helen Bailey, a digital curation analyst at MIT. In her spare time, Helen has become a data visualization expert. Helen provides data visualization support to the MIT Libraries and is sharing her knowledge of data visualization through presentations and workshops. If you think you are unfamiliar with data visualization, think again. I guarantee you have used data visualizations and maybe even created a few.

To set the record straight, let’s define the term before giving some examples and talking about why data visualizations are useful and what it takes to produce them. Helen offered the following two definitions:

“Information visualization is a mapping between discrete data and a visual representation.” from Lev Manovich, “What Is Visualization”

“Information visualization is a set of technologies that use visual computing to amplify human cognition with abstract information.” from Stuart Card, “Information Visualization”

While both definitions make sense, I prefer the second definition because a well-chosen visualization really provides meaning and understanding where there might otherwise be only information overload. It seems to me that the age old saying, “a picture is worth a thousand words” is appropriate when discussing the purpose and usefulness of data visualizations.

spreadsheet-v-map

Helen notes that visualizing data can be used to summarize a data set, highlight specific aspects of the data, and identify patterns and outliers. Data, typically organized in tables or spreadsheets, can be almost impossible to digest, especially in large quantities. Even smaller data sets contain so many rows and columns they literally run right off your screen making it difficult to draw conclusions or spot trends. Organizing the raw data into visual representations is really the only practical way to make the data useful.

alluvial

Alluvial Diagram

The first steps in creating data visualizations are to determine:

  • What questions will the data answer?
  • How the visualization will be used?
  • What is the best type of visualization to use?
  • Who is the target audience using the visualization?

It’s important to answer each of these questions because there are so many types of visualizations available. You can’t be a one-trick pony, reusing the same representation for all occasions. Certain representations work better for temporal (when), geospatial (where), topical/statistical (what, how much), relational (with whom) and hierarchical (ordered relationships) data.

cartogram

Cartogram

The types of representations range from simple to complex and from traditional to innovative. The names of the visualizations in the list below will either allow you to draw a picture in your mind’s eye or send you for a dictionary. A few types of the many available to consider are:

  • Gantt Charts, Stream Graphs and Alluvial Diagrams for temporal representations
  • Choropleths and Cartograms for geospatial representations
  • Histograms, Pie Charts and Heat Maps for topical/statistical representations
  • Node-link, Chord and Arc Diagrams for relational representations
  • Dendograms, Treemaps and Radial Trees for hierarchical representations

It’s easy to be overwhelmed by the choices. Helen presented a decision tree designed to help identify which representation to use depending on the parameters of your project. Do you need to show comparisons in your data over time with just a few periods of time but with many categories? Try a Column or Line Chart. But remember what Ben Fry mentions in Visualizing Data, data visualization is just another form of communication and it will only be successful if the representations make sense to your audience.

arc diagram

Arc Diagram

Are you interested in creating a data visualization for your project? Four members of our group were, and one of us has already created one of her own. Simple data visualizations, line, bar and pie charts, can be created with the spreadsheet application installed on your computer. If you have more complex data and feel like challenging yourself, there are several online tools available. Helen recommended and gave brief introductions to Voyager (http://vega.github.io/voyager), Tableau (http://www.tableau.com) and RAW (http://raw.densitydesign.org/) to mention only a few. Do be forewarned though, some of these data visualization tools have a steep learning curve and may be easier to use if you have some experience with coding and scripting.

If all else fails, use your Photoshop skills and convert your favorite data visualization into a piece of modern art or a poster to hang on your wall.

Thank you Helen Bailey for introducing NDSR Boston to  data vis! And thank you for reading.

Jeff Erickson

Image Credits:

  1. Spreadsheet image produced from a data set from the US Dept. of Labor, Bureau of Labor Statistics retrieved from http://www.bls.gov
  2. U.S. map image, Unemployment data visualization, created by Mike Bostock, retrieved from http://bl.ocks.org/mbostock/4060606
  3. Alluvial Diagram image retrieved from http://www.mapequation.org/apps/AlluvialGenerator.html
  4. Cartogram image retrieved from http://www.stephabegg.com/home/projects/cartograms
  5. Arc Diagram image retrieved from http://www.chrisharrison.net/index.php/Visualizations/BibleViz

Code4Lib

Last week I attended my first annual Code4Lib meeting in Philadelphia. Code4Lib started in 2003 as a mailing list and has since grown to a thriving community of hackers, cataloguers, designers, developers, librarians and even archivists.  This year was the 11th annual conference and there was a significant online presence, including an IRC, slack channel, and the hashtag #c4l16. All presentations and lightning talks from the conference were streamed live and the videos are still available on the Code4Lib YouTube channel.

c4llogo

Code4Lib 2016 Annual Conference logo

The week started off with a day of pre-conference workshops. I attended the Code4Arc workshop which focused on how coding and tech is used slightly differently in the archives world. Since archives have different goals and use different descriptive standards it makes sense to carve out a space exclusive to archival concerns. One common interest was in how multiple tools are connected when they’re implemented in the same archive. Many attendees were implementing ArchivesSpace to handle archival descriptions and were concerned about interoperability with other tools. Another concern was regarding the processing and management of hybrid collections, which contain both analog and digital material. Digital is often addressed as completely separate from analog, but many collections come into the archive containing both and that relationship must be maintained. Archivists in the workshop called for tools to be inclusive of both digital and analog holdings, especially in regards to processing and description.

I joined NDSR-NYC alum Shira Peltzman to kick-off the presentation part of the conference with a discussion of Implementing ‘Good Enough’ Digital Preservation (video here). The goal of our presentation was to make digital preservation attainable, even for those with limited support. We began with a brief overview of the three tenets of digital preservation – bit preservation, content accessibility, and ongoing management- before diving into specific resources and strategies for implementing good enough digital

c4l

Shira and myself presenting on “Good Enough” Digital Preservation

preservation. We defined ‘good enough’ as the most you can do with what you have – based on available staff and budget, collection needs, and institutional priorities. The main offerings from our presentation were expansions on the NDSA Levels of Digital Preservation. We mapped each recommendation to useful tools, resources and policy recommendations based on our experience in NDSR and beyond. We also proposed an additional level to address the access issues related to digital preservation, such as redaction of personal information and making finding aids publicly accessible. Since the NDSA levels are such a common tool for getting started with digital preservation, we hope that these additions will make it easier to move to the next level – no matter what level you are currently at.

Our talk ended with a call for engagement with our NDSA level additions and more generally, to share policies and workflows with the community. The call for shared documentation was a common thread through many presentations at the conference. Dinah Handel and Ashley Blewer also discussed this in their talk “Free Your Workflows (and the rest will follow)” (video here). They made a great point about why people don’t share their documentation – because it’s scary! There’s the constant battle against imposter syndrome, fear of public failure, not to mention the fear that as soon as a policy is polished enough to share widely it is also outdated. All of these are very real reasons to hesitate, but the advantages that come from shared documentation severely outweigh these reasons. And nowhere is this more true than in the realm of open source solutions. Open source projects often rely on the community to notify them of bugs and help create complete and accessible documentation. Shared policies and workflows help to build that community, and help the field understand how tools and strategies are actually implemented.

If you are reading this and thinking – I have documentation that I could share but where would I put it? Worry not! There are a few great places for sharing open documents.

Scalable Preservation Environments (SCAPE) collects published digital preservation policies

Library Workflow Exchange collects all library-related workflows, including digital preservation.

Community Owned digital Preservation Tool Registry (COPTR) is a wiki for all digital preservation tools, and provides a space for users to present their experiences with any given tool. This information is automatically pushed to the interactive tool grid created by Preserving digital Objects With Restricted Resources (POWRR).

Github is known as a repository for code, but it can also be a great storage option for workflows and documentation. It is especially useful for managing version control for live documents.

Do you know of another place to share digital preservation documentation? Let us know in the comments!


An Update from the State Library

In college, I took several courses that involved working closely with one of the many helpful librarians on campus. She would often refer to our projects as “iterative”– so much so that she would even laugh as she said it. Six months into my residency at the State Library of Massachusetts, the joke is on me as our process has been very iterative. This post will cover what we’ve been up to recently and what is ahead for us in the next few months.

A quick recap: we’re exploring more efficient ways of finding, downloading, and providing access to digital state publications. We’ve been working with web statistics downloaded from Mass.gov to assess the extent of digital publications and to determine what is most valuable to preserve for the Library and its users.

The web statistics workflow has, of course, evolved, requiring flexibility and an open mind. When we began using the statistics, each member of the project team was checking each URL listed, noting the type of document it was, then each of the team members would rank the document on a scale of 1-5 (1 being lowest priority, 5 being highest) using shared spreadsheets. Once we all had a solid understanding of what was highest and lowest priority, we determined that we didn’t need to each rank each type of document, so each staff member would tackle a different agency and enter their own priority rankings. We also created a new spreadsheet to consolidate that data into how many documents there were total and how many of each priority ranking. This gives a bigger picture assessment of how many state publications exist, and how many high priority documents we need to handle quickly. A few weeks later, we then decided to add a category in the spreadsheets to note whether these documents were series, serials, or monographs, which affects the way the items are cataloged. Though these are relatively minor changes in the workflow, they do reflect how important it is to continually check in with the project team about what’s working well and what could be improved. It is very iterative!

While that process is ongoing, we are also examining how to download the thousands of publications we’ve reviewed through the web stats. I researched tools that would help us batch download PDF or Word docs from sites, taking into account the Library’s resources. Though CINCH, a tool developed by the State Library of North Carolina, fits our needs well, the installation requirements were not feasible for us. I began playing around with a Firefox add-on called DownThemAll! (yes, the exclamation mark is part of the name– though it is very exciting). DownThemAll (dTa) allows a user to upload a list of URLs, specify the folder in which you’d like the files saved, then, like magic, the files are fully downloaded (dTa has other features and functions, such as a download accelerator). Any errors are noted and not downloaded, so you can go back and check if this was a 404 error or human error, for example.

The tool is free, easy, and works very well! My concern, however, is that it is not backed by an institution and it’s unclear how much funding or technical support they have. What if I come into work tomorrow and it’s gone? Who do I contact? Though they have some support help, it’s limited (for example, I emailed about an issue three weeks ago, and haven’t heard back). dTa works only with Firefox– what if there’s an issue with the browser and we can no longer access the tool? While the function of the tool works well and will be useful in the short term, I don’t see it being a sustainable solution for batch downloading. This is another part of the process that we’ll need to keep revisiting over time. And if anyone has ideas or suggestions, please let me know!

One big success we’ve had is collaborating with MassIT to gain access to their Archive-It account. Though MassIT manages the account, they’re capturing the material that we need– webpages with links to documents published by state agencies– so it makes perfect sense to work together to use Archive-It to its full capacity. I worked with MassIT to customize the metadata on the site, then I wrote some information to publish on our website about how to access and use Archive-It for the general public. We’re considering how best to incorporate Archive-It into our workflow. While DSpace will remain our central repository, where we can provide enhanced access to publications through metadata, Archive-It is capturing more material than we will be able to, which is a huge help to us. (Archive-It also allows us to print PDF reports to see all PDFs captured in their crawls, and we can use dTa to download them. We’re not currently using this now, but this is an option for the State Library to use going forward.)

With each iteration of the workflow, I feel we are getting closer to solving some of the big questions of my project. We hold weekly staff meetings to check in about the current process. Hearing each staff member’s thoughts on challenges or potential areas of improvement has taught me much about how to continually bring fresh eyes to an ongoing process, and how to keep the big picture in mind while working through smaller details. Flexibility is key not only with this project, but with digital preservation as a whole, as processes, tools, software, and other factors continue to evolve.

I hope to leave the State Library with some options of how to take this project forward, even if not all of the questions have a definitive answer. We’re also now focusing our attention on addressing other issues in the project, such as outreach to state agencies and the cataloging workflow between their OPAC, Evergreen, and DSpace. There’s much to accomplish in the remaining weeks, and I look forward to updating you as we make progress on these goals.

Thank you!
Stefanie